Using CurinosConnect
CurinosConnect provides access to Curinos data sources directly from Excel. On this page, you will learn how to:
- Access, open and log in to CurinosConnect.
- Get started using the Data Filters to define a dataset.
- Use CurinosConnect to pull additional datasets and use multiple worksheets.
- Create advanced formatted reports, including PivotTable and PivotChart reports along with some Best Practices for using Excel formulas with CurinosConnect.
- Use Data Visualization software (like Tableau or Power BI) with your CurinosConnect workbooks.
- Share your workbooks with colleagues.
To log into the CurinosConnect Excel Add-in - after it is activated - do the following:
The CurinosConnect pane is displayed on the right, prompting you to log in.
Tip: Use the same Email Address and Password for CurinosConnect that you use for your Curinos Analyzer application. You will be prompted to enter a 1-time Pin (emailed to you within a minute) on your first login as well as some subsequent logins. Note: Your password will always be the same for CurinosConnect and your Curinos Analyzer application.
It may take up to 15 seconds for the Data Filters to load in the pane. Note: You may be required to enter a new Pin on login for various reasons (e.g., CurinosConnect update, security requirement).
|

|
 .
. (this is your only option upon logging in).
|
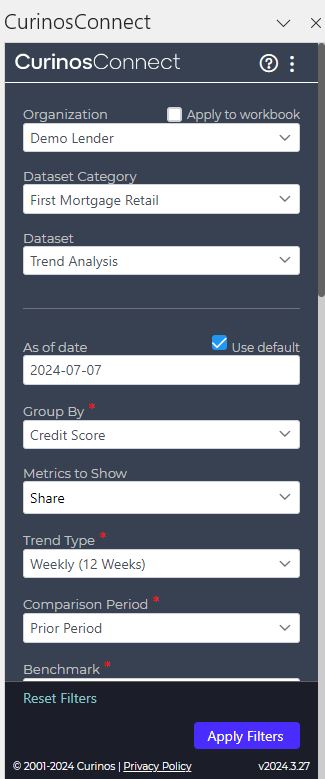
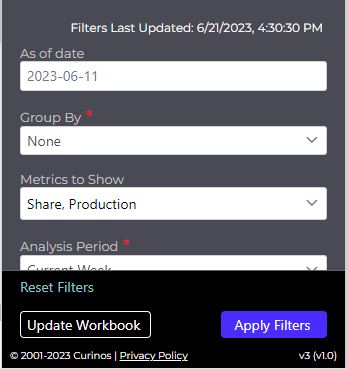
The Organization drop-down will default to your institution.
Use the appropriate Data Filter Definitions table available within the browser app eHelp - they differ for each application and Line of Business (if applicable) within each application. A red asterisk (*) indicates that a Data Filter is required (e.g., Group By *).
The Excel workbook is populated by your data. Refer to the Data Column Definitions available within the browser app eHelp for column header definitions. They differ for each application and Line of Business (if applicable) within each application. |
|
||||||||||||||||
 .
.
|
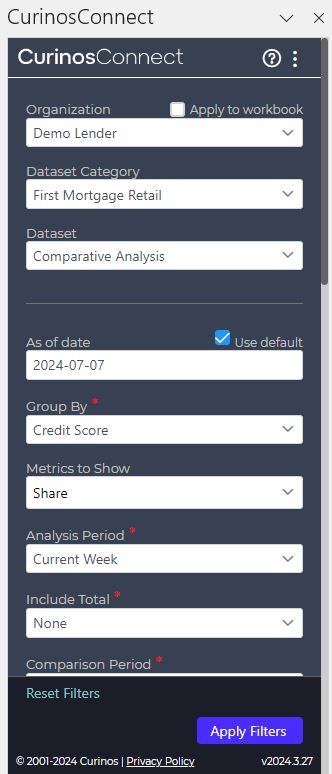
Once CurinosConnect is added to Excel, it is available to use in any Excel workbook. You can use CurinosConnect with as many workbooks as you’d like, or you can combine all your CurinosConnect analytics in a single workbook – it’s up to you! Note: Dataset parameters are saved in the memory of each Excel workbook – so viewing or making changes in one workbook has no impact on other workbooks
Tip: From the bottom of your worksheet, click + beside Sheet 1:
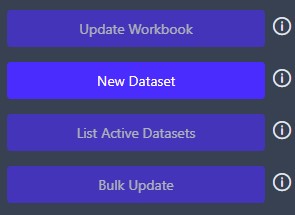
Note: For details on other dataset options (i.e., Update Workbook, List Active Datasets, and Bulk Update) please refer to Opening a Saved Workbook and Working with Multiple Datasets below.
Use the appropriate Data Filter Definitions table available within the browser app eHelp - they differ for each application and Line of Business (if applicable) within each application. A red asterisk (*) indicates that a Data Filter is required.
The Excel workbook is populated by your data. Refer to the Data Column Definitions available within the browser app eHelp for column header definitions. They differ for each application and Line of Business (if applicable) within each application.
CurinosConnect remembers the parameters you used. You can now switch back and forth between sheets that contain CurinosConnect datasets, CurinosConnect remembers the parameters used on each sheet. |
|
|||||||||||||||||||
 .
.
|
CurinosConnect datasets use the latest available data by default. The As Of Date parameter will automatically update for all new and existing datasets that use the default As Of Date setting. If there are two or more CurinosConnect datasets open in an Excel workbook (on two different sheets, you can update all CurinosConnect datasets in the workbook that use the default As Of Date setting with the latest data:
|
|
|||||||
|
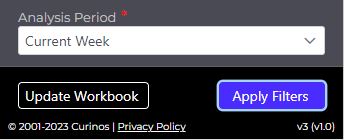
Refer to Pulling a second dataset (and have both datasets open at the same time) above for details. With multiple sheets open, an Update Workbook button is displayed next to Apply Filters.
Note: While CurinosConnect datasets use the latest data by default, it is also possible to fix a dataset to an older period. Update Workbook will not automatically update any dataset that uses a fixed As Of Date. Refer to Using CurinosConnect to Pull Older Datasets for more information. |
||||||||
 .
.
|
Refer to Pulling a second dataset (and have both datasets open at the same time) above for details. If necessary, refer to Tracing which Dataset was used to populate a PivotTable, PivotChart or Excel Formula (if multiple sheets open)for details.
A Reset Filters option is displayed above the Update Workbook and Apply Filters buttons.
|
|
||||||||||
 .
.
|
When you open a previously saved Workbook - or - a second or third Sheet within a Workbook (i.e., Excel file), you have multiple options:
|
|
|
|
You can create an identical copy of the current Sheet, including all filters, onto another Excel Sheet by doing the following: With an existing CurinosConnect worksheet open in Excel - -from the upper-right corner of the CurinosConnect pane, click |
|
|
 and choose Duplicate Sheet.
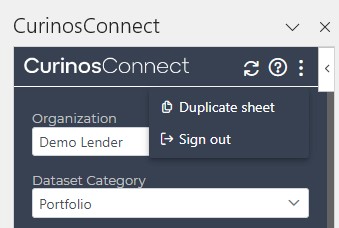
|
Note: While the best practices outlined here are geared towards intermediate and expert Excel users, we work hard to ensure CurinosConnect is powerful and easy-to-use for Excel users of all abilities. Please feel free to use any Excel features and functionality you prefer and feel most comfortable with, and don’t hesitate to reach out to us if you have questions about alternative approaches. You can consult a starter workbook provided by Curinos for some examples of formatted reports that use CurinosConnect datasets. CurinosConnect Automatically Formats Datasets as Excel TablesWhen a dataset is pulled onto a new Excel sheet, CurinosConnect automatically:
Each time filters are applied, CurinosConnect automatically resizes the Excel table to match the number of rows and columns in the new dataset. For example, if Trend Type, Group By, or Metrics to Show are changed, the number of rows and columns will often change, and CurinosConnect will automatically resize the named Excel table to match the new dataset. For information about using Excel tables, please visit Microsoft help: https://support.microsoft.com/en-us/office/overview-of-excel-tables-7ab0bb7d-3a9e-4b56-a3c9-6c94334e492c |
|
Note: While the best practices outlined here are geared towards intermediate and expert Excel users, we work hard to ensure CurinosConnect is powerful and easy-to-use for Excel users of all abilities. Please feel free to use any Excel features and functionality you prefer and feel most comfortable with, and don’t hesitate to reach out to us if you have questions about alternative approaches. Using dynamic formulas that search for values in a table based on the row and column headers can be helpful to ensure the desired metric is returned – particularly if the number of rows and/or columns in the dataset change (e.g., the number of columns in the dataset could change based on Metrics to Show; the number of rows in the dataset could change based on Trend Type or if additional filters are applied). See these Excel help articles for more information:
Excel tables (such as the Excel tables automatically created by CurinosConnect for each dataset) support structured references based on table and column names. Refer to Microsoft help for more information: https://support.microsoft.com/en-us/office/using-structured-references-with-excel-tables-f5ed2452-2337-4f71-bed3-c8ae6d2b276e. Alternatively, you can also use CurinosConnect with simpler formulas. Just make sure your reports are updating correctly after using CurinosConnect. You can consult a starter workbook provided by Curinos for some examples of formatted reports that use CurinosConnect datasets. |
|
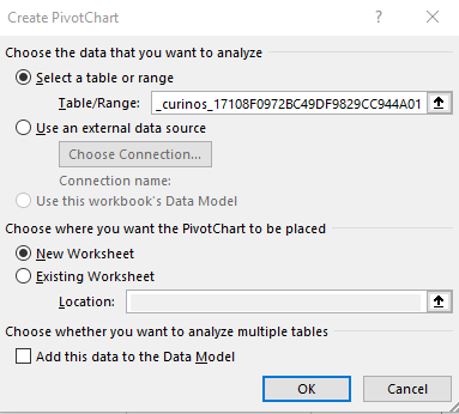
Note: While the best practices outlined here are geared towards intermediate and expert Excel users, we work hard to ensure CurinosConnect is powerful and easy-to-use for Excel users of all abilities. Please feel free to use any Excel features and functionality you prefer and feel most comfortable with, and don’t hesitate to reach out to us if you have questions about alternative approaches. Click anywhere in the Excel table populated by CurinosConnect and use the Insert tab on the Excel Ribbon to add a PivotTable or PivotChart. Note: You can also use Excel formulas to create formatted reports.
|
|
||||||||||
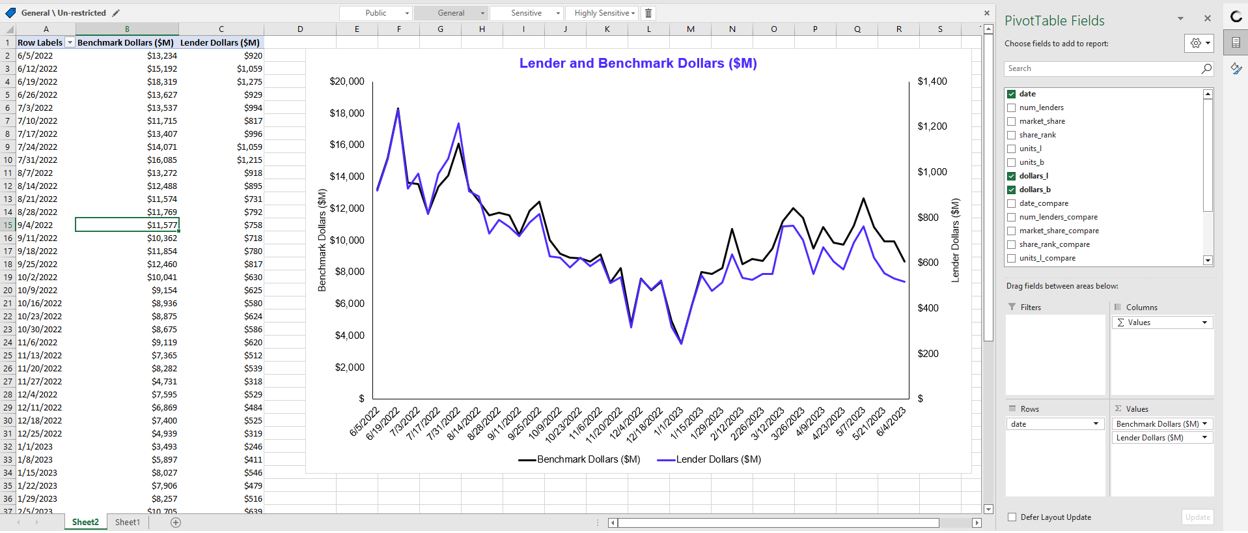
The PivotTable and PivotChart are displayed (see below). Tip: While you can use explicit sheet and cell references in PivotTable and PivotChart data sources, using the Excel table name as the data source will ensure that the PivotTable or PivotChart data source changes automatically when the number of rows and columns changes (e.g., if you change Trend Type from 12 Weeks to 53 Weeks, all rows in the dataset will be included automatically when you refresh the PivotTable). |
|
|
|||||||||
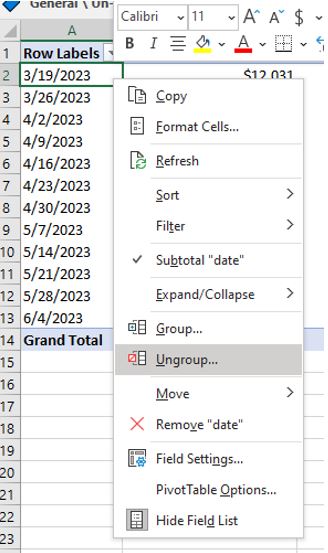
Refer to Microsoft help for more information: https://support.microsoft.com/en-au/office/group-or-ungroup-data-in-a-pivottable-c9d1ddd0-6580-47d1-82bc-c84a5a340725. Tip: CurinosConnect connects to Curinos application databases and provides user-friendly datasets with key proprietary metrics directly in Excel. We do not recommend using Excel to aggregate across multiple rows of CurinosConnect datasets because the aggregation in Excel may not match the CurinosConnect methodology. Note: We also do not recommend using PivotTables to calculate Subtotals or Grand Totals from CurinosConnect datasets. In the PivotTable Tools (shown in the Excel ribbon when you click anywhere in the PivotTable), use the Design tab to turn Grand Totals Off for Rows and Columns and to click Do Not Show Subtotals. Refer to Microsoft help for more information: https://support.microsoft.com/en-us/office/show-or-hide-subtotals-and-totals-in-a-pivottable-fc4d8406-f230-4762-aa2f-310826f3e5e2 |
|
|
|||||||||
|
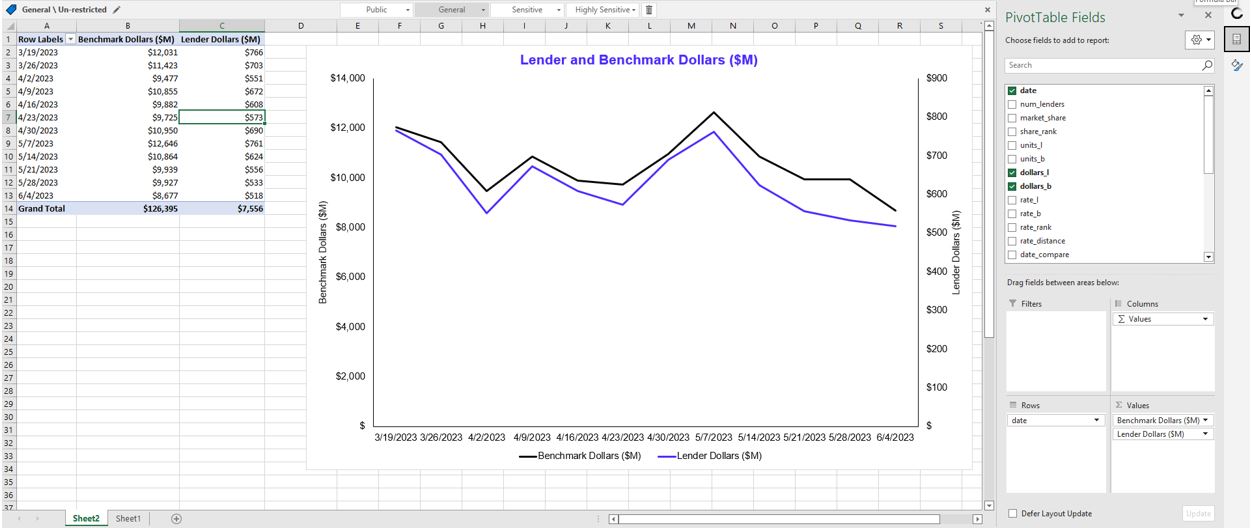
After updating CurinosConnect datasets, you’ll need to refresh all PivotTable and PivotChart data sources in your workbook.
Your PivotTable and PivotChart is updated (see below). Tip: Refer to Microsoft help for more information: https://support.microsoft.com/en-us/office/refresh-pivottable-data-6d24cece-a038-468a-8176-8b6568ca9be2
|
|||||||||||
|
Note: While the best practices outlined here are geared towards intermediate and expert Excel users, we work hard to ensure CurinosConnect is powerful and easy-to-use for Excel users of all abilities. Please feel free to use any Excel features and functionality you prefer and feel most comfortable with, and don’t hesitate to reach out to us if you have questions about alternative approaches. If you have access to data visualization software (e.g., Tableau, Microsoft Power BI) and would like to use CurinosConnect with them, you can! While CurinosConnect cannot be accessed as a data source directly in Tableau or Power BI, Microsoft Excel can be used as a data source in both platforms. Connecting to CurinosConnect Datasets
For more information on using Microsoft Excel as a data source in Tableau: Refer to Tableau help for more information: https://help.tableau.com/current/pro/desktop/en-us/examples_excel.htm. For more information on using Microsoft Excel as a data source in Microsoft Power BI: Refer to Microsoft help for more information: https://learn.microsoft.com/en-us/power-bi/connect-data/service-excel-workbook-files. Note: Each CurinosConnect dataset should be a separate data source (rather than joining multiple datasets to each other in a single data source). Updating or Modifying CurinosConnect Data SourcesIf you would like to update your dataset parameters or use Update Workbook to update all your datasets with the latest data:
Note: If you have used CurinosConnect recently, you will remain logged in even if Excel was closed.
Note: While you can keep your data visualization software open, you will need to close Excel to refresh your data sources
Pro Tip: If you’re using Tableau, use Extracts so you can update all data sources in one click. See Tableau help for more information: https://help.tableau.com/current/pro/desktop/en-us/refreshing_data.htm. Sharing Data Visualization Software WorkbooksYou can share workbooks created in your data visualization software as you normally would. Just note that you should share your data sources along with data visualization workbooks if you want users to be able to view or modify the parameters used to generate them. |
|||||||||||||||||||||||||||||
|
|
|
|||||||
|
||||||||
|
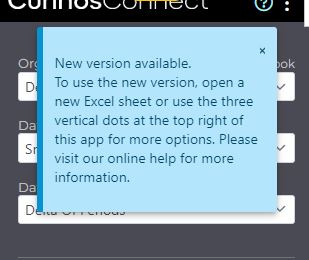
When we upgrade CurinosConnect datasets, we will often continue to support older versions. This ensures that existing formatted Excel reports can continue to be used and updated without needing to reconfigure CurinosConnect. When we release new versions, we post an update on our page and here on this subtopic. |
||
New vs. Existing Dataset VersionsNew Excel worksheets using CurinosConnect use the latest version by default. For existing Excel worksheets that pre-date a CurinosConnect upgrade, you will be notified when you are using an old dataset version, and you can then choose whether to upgrade or not. By default, CurinosConnect will continue using the Version saved on each sheet. |
|
|
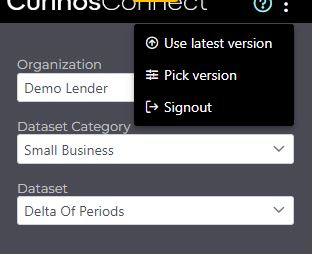
Use Latest Dataset VersionThe Use latest version selection allows you to automatically upgrade to the latest Dataset Version. Use Latest Version will generally retain any selections it can and select default options for new parameters or for existing parameters that no longer include prior selections. When we upgrade CurinosConnect, we will often continue to support older versions. This ensures that existing formatted Excel reports can continue to be used and updated without needing to reconfigure CurinosConnect. When we release new versions, we post an update on our page and here at the top of this subtopic. |
|
|
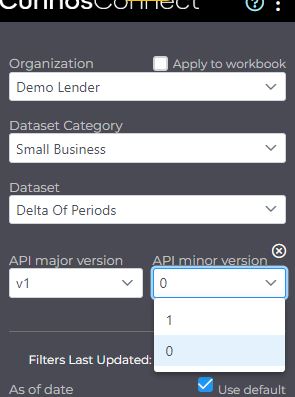
Pick VersionYou can also use the Pick Version selection to select any Dataset Version you want – either older or newer. Pick Versionallows you to choose both the Major and Minor version - see right. Changing the Dataset Version will not retain any parameter selections – it works similarly to switching the Dataset used on this sheet. |
|
|
|
When CurinosConnect pulls datasets into an Excel workbook, the dataset parameters are saved as part of the Excel file. When you share a CurinosConnect workbook with a colleague (or a Curinos client services representative), they will be able to view (and modify) the parameters used in any dataset to which they have access.
Note: If you have recently used CurinosConnect, you will often be able to use it without logging in again even if Excel was recently closed. However, this saved login information is specific to your computer. This means that if you use CurinosConnect, save an Excel file, and email it to a colleague, they will always be prompted to log in – even if you wouldn’t be prompted to log in again for the same Excel file on your computer. Note: As with any Excel file, data, tables, and charts saved visibly in the file will be visible to recipients. If you email a workbook to a colleague who does not have CurinosConnect installed, they will be able to see all data and analytics in the workbook. They just won’t be able to see the CurinosConnect parameters used to pull each dataset (unless those are also noted somewhere outside CurinosConnect in the Excel file). |
Related Topics
| CurinosConnect Overview | ||
| Activating the Excel Add-in | ||
| CurinosConnect FAQs | ||